Post Updated February 15, 2024 to include information on Google Search Console and Core Web Vitals along with additional text updates
Google’s algorithm is largely opaque. For users, it’s nearly impossible to determine what factors boost rankings and what can lead to performance drops. This makes sense, of course, considering that Google likely doesn’t want to give away much about their trillion dollar business.
However, Google does make it clear that speed is an important factor when it comes to determining rankings. This conclusion was first noted regarding desktop page speed back in 2010 and was reiterated in 2018 as it related to the speed of mobile pages. The big takeaway: a page that loads faster is sure to rank higher.
Grading Speed with Google PageSpeed Insights
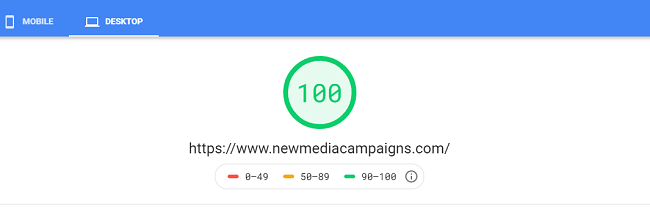
For years, Google PageSpeed Insights has been the main tool/offering from the search-behometh to let you get an understanding for how a site is performing in their eyes. The tool has gradually been improved over time to offer more and metrics, but it always boiled down to a run score from 0-100. It would correlate a color of red, yellow, or green, based on whether it considered that score failing, fine, or phenomenal.
Over time, Google started to include additional context about the score and report out what it saw as the issues that were impacting your score. The transparency helped developers and marketers know where to make improvements on their site; the Diagnostics section of the tool would break down things like requests, render-blocking resources, whether the CSS and JavaScript was minified, and more. It was a cheat-sheet to help you quickly identify and fix performance issues on a site.
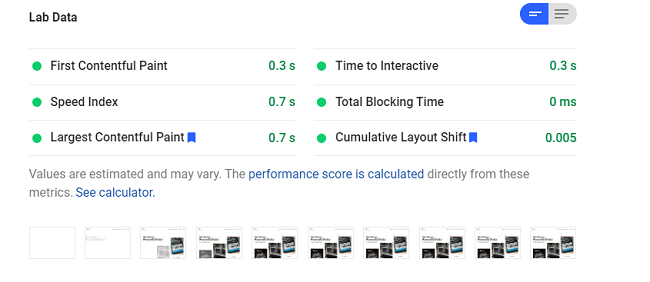
The tool focused on Lab Data to let you know how how Google assessed it, and more data around what was contributing to that assessment. Even with all of this data, for much of the life of Google PageSpeed Insights, we were left with just the top line score to judge a site by and not know too much about how that was calculated or factored into ranking.
Although the value of pagespeed has been made publicly clear by Google, Google hasn’t always clarified how speed is measured and what adjacent factors are taken into account. PageSpeed Insights tool has long offered a helpful baseline, but it consistently fails to provide a true user experience score because the data is lab generated.
To address this concern, Google released Core Web Vitals, a score and tool that provide specific details on your site’s real-life speed and experience. We're advocates of using CWV as the roadmap to improve your topline score, and it can shed a lot of light on what you need to update to make a slight, but important, jump from an 89 to a 95. But more importantly, Google now acklnowledges that the individual elements of Core Web Vitals impact ranking, so going beyond just a topline score, this tool and score enable you to get firsthand knowledge of where to improve your site to impact your ranking.
This article goes on to look at a few things around Core Web Vitals, from the basics to how to use the tool to how to leverage Google Search Console. You can read straight through if you're just learning about Core Web Vitals or use the links below to hop to the most relevant section for you.
- What Are Google Core Web Vitals Scores?
- Using Core Web Vitals Scores to Improve Your Website
- Using Google Search Console with Core Web Vitals
About the Website Scores in Google’s Core Web Vitals
We’re going to explore the factors that contribute to Google’s Core Web Vitals and explain how to use the measurements to test your website efficiently. While we’ll go into a good amount of detail about what can hamper user-experience, score, and ranking, please know that the post isn’t exhaustive and that it may skip over some of the elements that we consider to be a given for each new build. That said, don’t hesitate to reach out to us with any questions about your specific situation.
Web Vitals are the four new measurement scores that Google uses to evaluate the speed of a particular URL. Before diving into the measurements themselves, it’s important to note that each one will be impacted by the real-world circumstances under which the website is tested. For example, a site tested on a fast laptop with broadband internet is going to receive different scores than a site tested on an old cell phone with 3G internet. That said, it’s crucial to account for the fact that any data is shaped by both the site’s performance and the device’s capability.
On to the good stuff. To start, here’s an introduction to the four measurements that make up the Web Vitals Score:
- FCP - First Contentful Paint
- LCP - Largest Contentful Paint
- FID - First Input Delay
- CLS - Cumulative Layout Shift
These measurements all cover something different, but it's worth noting that the first three measurements are about how quickly the page is ready for a user. The last one, Cumulative Layout Shift, measures how much the content of a page jumps around both while the site is loading and throughout a user's time interacting with a page.
It's also worth noting that this entire writeup ignores server-side performance. It takes for granted that your web server will quickly serve an HTML response to a URL request. This is the very first thing that MUST happen on every pageview and if it's not fast, every measurement taken is going to be bad.
Here are a few more details on what each of these measures means and how results might be delayed in the real world:
First Contentful Paint
This is the time that it takes from the browser's initial request of a URL to when anything is first drawn on the page. The idea for this measurement is that the perceived loading time of a page is improved when users are shown that progress is being made. This is the idea behind showing placeholder loading UI.
In the past, this score carried more weight. Sites went a bit overboard trying to game their FCP measurement, but luckily some have realized that it's not helpful to show placeholder loading UI if doing so delays the arrival of the actual content.
In general, this score can be held up by things that block render, including stylesheets and scripts. Whenever a stylesheet reference is added to HTML, rendering is blocked until that resource is fully downloaded and parsed. The same is generally true of scripts, though they can be added with 'defer' or 'async' attributes. Those options are not available by default for styles, although there are tricks available like using the media attribute in combination with an onload event.
FCP score can be improved by only sending the resources necessary to render what’s visible to users in the viewport. There’s no need, for example, to ask the browser to immediately download images that show at the bottom of the page, or to download styles that apply to other pages on the site. This is why we use lazy image loading and inline styles that only apply to a particular page.
Largest Contentful Paint
LCP is a new measurement that attempts to measure the time from the initial request to when the site's actual content is ready. That means that it waits until fonts and images in the viewport are fully loaded. Now that LCP is being measured, some of the tricks that sites would use to boost their FCP have turned out to be counterproductive.
For example, poorly implemented lazy-loading images can be problematic if a JS lazy-loading image appears in the viewport. Now, the FCP must wait not only for the image to load, but also for the lazy-loading JS to download, parse and execute. Needless to say, boosting the FCP at the expense of showing the actual content sooner is not a good practice.
In order to improve the LCP, it’s important to include the site fonts properly and make sure that the images in the viewport can load as quickly as possible. The latter can be done by using a native image tag with srcset or a picture element. Essentially, the goal is to ensure that all content in the viewport can be displayed with as few serial dependencies as possible.
First Input Delay
You know when you visit a really heavy page on your phone and everything feels choppy as the content loads in? That choppiness is called input delay. You ask the page to scroll, but it can't, because your phone is too busy doing a bunch of processing.
The processing that is occurring could be any number of things:
- Rendering complex styles
- Parsing assets
- Showing video/graphics
- Running a bunch of javascript
- The most common cause of FID is excessively complex JS from third parties like trackers and advertisers. But it can also be caused by scripts and libraries used on the site itself.
In order to reduce FID, the best thing to do is to reduce the amount of JS that runs on a given page. Then, of the remaining JS, procrastinate any JS that isn’t critical for the user experience. If you can, wait to download this non-critical Javascript until after the window.load event. On many sites, this makes sense even for analytics!
It has long been considered a good practice to include asynchronous analytics scripts as soon as possible on the page. This is done so that they can load as soon as possible and track all visits – even if they’re very short. However, if you have a good performing site, waiting for window.load doesn’t take very long at all.
A big thing to realize about FID is the degree to which it is impacted by device performance. This goes back to our comparison between the fast laptop and old cell phone. The measurement that is being taken for the FID score is time – it's not 'amount of scripts'. A modern computer can handle a LOT of computation in a very short period of time, but an older phone cannot. So even if you see a great FID score on a laptop, that may not mean much in the real world when your site is being visited by a variety of devices. Worse yet is the fact that when a site is running slowly, it tends to snowball.
A fast laptop might get the site rendering out of the way immediately and then start working on the non-critical javascript. A slower device might have all of the site's resources start to pile up and have a hard time finishing any of them at a given time. It's not uncommon for a device that’s half as fast to take four-times as long to be ready for user input.
Cumulative Layout Shift
As mentioned above, this measurement is unique because it’s ongoing. It measures how much site content jumps around as things load throughout a user's time on a page. This score is looking for situations where the text that you're reading suddenly jumps out of view, or the button that you’re about to click shifts to a different location due to page loading. Layout shift is a very frustrating experience that is often caused by efforts to improve initial load time.
The primary culprit for layout shift is image loading. When a simple image tag is put on the page without additional information about the image’s size, the browser has no idea how much space to reserve for that image until it actually loads. This means that your layout can be held up waiting for an image to be properly displayed. Images are typically the largest assets on a site, so you can see why this is problematic.
Now that CLS is being measured, it’s proven to be a bit of a “gotcha” even for sites that are attempting to do the right thing. How? Many developers use the PageSpeed Insights tool to test site performance. This is fine, but it only provides a snapshot score at the time of initial render. What that means is that lazy loading images – which are invisible to the tool because they load later – leave developers unaware that layout shift will occur when images fully load.
As a result, many sites receive great scores on the first three metrics but a terrible user-experience and CLS score. The solution is to reserve space for every image on your site by declaring dimensions or proportions in either the HTML, the CSS, or a combination of the two.
Using Web Vitals Measurements to Build Faster Websites
Now that these measurements have been introduced, it's important to discuss the best way to monitor them when working to build a site. There are three main sources of measurements to keep in mind:
- The actual Field Data that Google has for a given page.
- Lab Data from Google PageSpeed Insights
- Lab Data from the Web Vitals Extension
The italicized distinctions are worth highlighting. Field Data is a real world measurement from actual users. It’s based on true user-experience and it drives the SEO performance of a given URL. Lab Data consists of a measurement taken at a given time under specific circumstances that might not match the real world. Just because it's possible to pull good lab data for a given URL, it doesn't necessarily mean that actual field data will improve. And if you've done work that shows up in your lab data, it may take some time for enough real-world measurements to show up in the field data.
Below we’ll go into a bit more detail about each of the three data sources.
Field Data
There are a number of ways to get access to Google's field data that are well covered by this blog post. The easiest ways, however, are to either look in Google Search Console under Enhancements > Core Web Vitals or in a PageSpeed Insights report under the “Field Data” section. PageSpeed Insights will generally show you aggregate field data for the domain that’s being checked, and, if the checked URL is popular enough, it will also show field data for the specific URL.
The field data is generally a running average of performance for the previous 30 days. However, if big improvements have been made to the site, it can show up more quickly, particularly if a request is made through Google Search Console.
Looking at field data is the only way to know for sure how a given page is performing.
Lab Data from the PageSpeed Insights Tool
PSI is a wonderful tool that lets you quickly check the performance of a given URL against a simulated mobile and desktop device. At the time of writing, the simulated mobile device was a very-old Motorola G4 with a slow connection. If your page has a problem, PageSpeed Insights will almost certainly show it.
In addition to showing scores, it also shows suggestions. Now, it even shows suggestions that are tied to particular Web Vital metrics. For example, if there is a large, unoptimized image that shows up above the fold on page load, it will likely list that image as a problem under “First Contentful Paint.”
One thing to keep in mind when analyzing the suggestions is that any audit that has been "passed" is hidden by default. While this is helpful to reduce clutter, it sometimes hides important information. It is not uncommon for a particular URL to have a poor FID while passing all audits. When that is the case, it's worth digging in to see how many barely passed. Everything can start to add up.
The biggest thing to keep in mind with the PageSpeed Insights Tool is that it cannot effectively measure CLS since it does not interact with the page for more than a moment. If a page has layout shift issues when scrolled, this tool will never find those issues.
Lab Data from the Web Vitals Extension
It is also possible to quickly check the Web Vitals scores for any page you visit using the Web Vitals Chrome Extension. This can be very handy because the extension quickly shows a red or green light for a given page while also measuring layout shift as you interact with it. So if you were to scroll down a fast page that has layout shift problems, you could literally see the extension light change from green to red.
The most important thing to remember with the extension is that it is measuring using your device and your internet connection. If there are problems related to excess scripts running or oversized images and assets, you may not notice them on a fast device with a fast connection. The extension won't either.
Google has made it possible to simulate the performance of a slower device with a worse connection using Device Mode. This can be very helpful in combination with the extension since it will allow you to quickly check any number of pages as you browse around a site.
Using Google Search Console to Diagnose Core Web Vitals Score Issues
Since the date of this original post, Google has also folded its Core Web Vitals scores into Google Search Console, which is very helpful to see your website's scores displayed in a central place alongside other Search criteria and data. Additionally, Search Console not only pulls in the your web vitals scores from across your entire site, but it also provides helpful tips on how to fix any issues that may be causing a score below green.
First, it's important to make sure you're using Google Search Console. It's a very powerful tool that allows you to see the search queries garnering impressions for your pages, which terms are actually driving traffic to what pages, how your site is ranking in Google, and how those things are trending over time. Years ago, this data was displayed in Google Analytics, but with increasing privacy awareness, they removed the data from displaying in Analytics on its own and required it to be pulled separately from Search Console. You can setup a Search Console property at search.google.com/console/, and you can connect it to your site typically by adding a DNS record or a text snippet file.
Search Console is helps you answer pesky Analytics questions like, "why did I see that downturn in organic traffic last month?" Rather than guessing at the cause or trying to determine it based on SEMRush or other data, you can get it straight from the source, Google! Search Console will let you see the difference in clicks and impressions for different terms and pages, letting you zero in on the exact cause of what led to the change in traffic. While I could extoll the value of Search Console in tracking and marketing your site for awhile, this post is focused on Core Web Vitals, so I want to specifically touch on how Google Search Console can help you understand and execute against your CWV scores and liabilities -- and these may also be leading to that downturn in organic traffic you're chasing down!
In Google Search Console, there's a whole section called Core Web Vitals. If you click on that, you'll get a snapshot of your entire site with Google giving you a breakdown of how many indexed URLS are in Good, Needs Improvement, and Poor Standing. They even separate out those scores between mobile and desktop. You can see an example of the baseline report below.
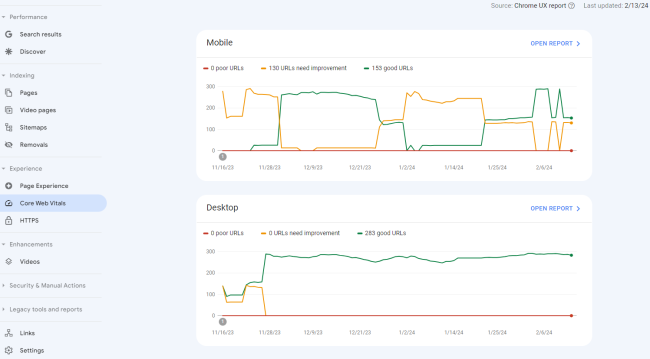
Remember that while both matter, pay particular attention to how you're doing in Mobile as Google ranking gives priority to mobile pages/experiences. Also, mobile is likely where you'll see more issues since anything on desktop will likely definitely show up on mobile, but mobile may have some issues unique to it. Now that you have a snapshot, you can click into "Open Report" to get more detailed analysis, and this is where Search Console really proves its value.
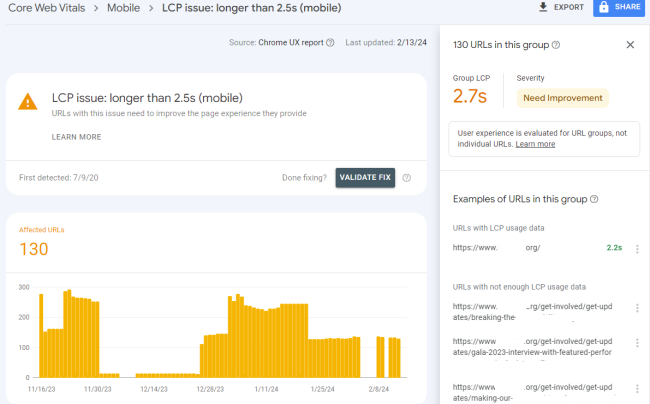
The Report doesn't just generally site as having pages that need improvement -- it actually gives you breakdown of the precise pages and exact issues! This information will help you substantially cut down on testing time as you have all the information you need at your fingertips. You can see in the screenshot below that Google splits the pages into different "groups" to let you try and address similar issues at a template-level. You can then pop open a group to see the specific issue, LCP in this case, and even get more information on developer resources to fix the issue on a specific issue.
In a matter of minutes, using Search Console, you're able to see scores, potential issues, and recommended fixes across your entire site for one of the few ranking factors that Google publicly acknowledges. Consistently monitoring your scores in Search Console can make a real difference in your ranking by working to keep all pages, and especially important search pages, scoring in the green.
In Conclusion
All of this information can feel overwhelming, particularly if each point is considered without proper context. However, each detail of Core Web Vitals extends from a very basic principle: Google wants fast sites with good user-experience to rank higher. And while the metrics in this post are current now, it’s reasonable to expect that Google will continue to reassess and tweak their testing practices to better address that goal.


Comments
Sneeza
Great Post.Please keep up writing. Sneeza Cool Math Games https://www.sneeza.com/cool-math-games/ . Thanks in advance. Waiting for your next post.Leave a comment