Using Nokogiri, the Data Science Toolkit, and Github to map local crime data
The other night I couldn't sleep, so I did what any person would do at 2am -- I opened my local government's website and found some data to play around with for a few hours.
 While my motivation was partly due to a general eagerness to learn more about what was going on in our community, the primary reason was that earlier in the day a friend had mentioned they'd like to find which route between their home and the gym had the least amount of reported crimes along it. The Durham Police Department does (kind of) show a map of crimes, but it's far from user-friendly and wouldn't work well for planning a route.
In order to determine the safest route, I needed to:
- Change the crime data into a format that's easier to use
- Map the crime data so that it is easier to view the data and select a route
While the setup below is being used for crimes, I used a similar setup to generate GeoJSON for a food inspection app being built by Code for Durham. Because the city provided CSV files with the past few years of Durham health inspections, there was no need to scrape a website for the initial information.
1. Getting the data
First we need to find the crime data that we want to map. After a check of the City of Durham Police Department website didn't pull up CSV or similiar file that I could download, I decided to scrape the data from their HTML. Fortunately it's displayed on their website in an HTML table that is simple to parse with code.
I'm a Ruby guy and my go-to library when I need to parse HTML is Nokogiri. If you aren't familiar with Nokogiri, the Bastards Book of Ruby has a useful introduction.
Before running the script, be sure to update the paths in the script to where you want the output. Then, since these are all command line scripts, run it in Terminal: ruby scraper.rb.
2. Geocoding the data
While the Geocoder gem is a library I frequently use with Ruby projects, API restrictions prevented it from being an option for this project. Last week I discovered the Data Science Toolkit and had good luck converting addresses to latitude and longitude coordinates with it, so we will use it again for converting the addresses provided by the Durham Police Department into mappable data.
There are a few options for using the toolkit:
- Through the API on the project website. Since I needed to bulk geocode over 12,000 addresses, blasting their server with requests in a short period of time likely isn't something they want, so this option was out.
- By running the toolkit locally with a Vagrant VM. While Vagrant is great and we use it for custom apps at New Media Campaigns, it was 2am when I was writing these scripts and I didn't want to wait for the Vagrant box to download and build. If time wasn't an issue, this would have been the way I'd used the toolkit for geocoding.
- Running the toolkit on an Amazon EC2 instance. Since an EC2 instance can be created and destroyed in a manner of minutes, I went this route. Search for "Data Science Toolkit" as the template for your instance, click create instance, and you should be good to go. Once you are done, don't forget to destroy the instance so you don't keep paying server costs.
After geocoding the addresses, you may notice some outliers where, for a variety of reasons, they weren't coded correctly. These can be changed manually to the correct coordinates.
3. Converting the data
Cool! Now that we have all the crimes in a nice JSON file, we should convert it into a GeoJSON file so it's easy to integrate with maps on Github or through Mapbox.
4. Sharing the data
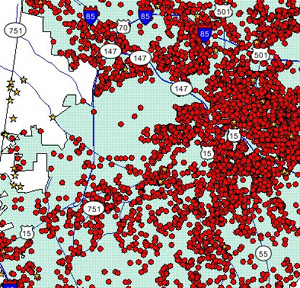
Now that have the 2013 Durham crime data in a friendly data format, let's share it on a map. Github's mapping integration has quite a few options built in, so it's a great choice if you need to quickly display data without the overhead of setting up an HTML page with an embedded map.
For mapping on Github, all we need to do it upload the GeoJSON file and Github will handle everything else required for mapping the file. GeoJSON can be rendered in either a repository or a gist, and we even have the option of embedding the map on pages outside of Github.com like below. I uploaded the 2013 Durham crime data to a gist since I wasn't using a repo at the time to store these scripts and data.
The scripts and data used in this post are available at github.com/tylerpearson/durham-crime.
If we wanted to spend a bit more time setting up a map, we could load the GeoJSON as a layer on a Mapbox map. Once that's set up, there's a wide array of possibilities for displaying the data -- we could do things like animate the change in crime over time, setup a crime heatmap, build an automatic walking route generator that avoids high crime area, and much more.
If you find this interesting, check out your local Code for America brigade and do some civic hacking to help out your community. It's a lot of fun. The brigades currently in the Triangle are Code for Durham , Code for Raleigh, and Code for Cary.
Update 12/3/2013: It was pointed out on Twitter that the City of Durham shares crime data with RAIDS Online, where it can also be viewed on a map.
Related Posts


Comments
Adam Ferguson
Very cool! Fun use of Nokogiri and Github's GeoJSON capabilities.Leave a comment